
One consistent challenge facing the small business M&A industry is a lack of consistent and useful data for market participants. Up to this point, information about businesses for sale has been messy, disaggregated, and unreliable. At Private Market Labs, we are committed to providing heightened transparency to our industry. One way we’re accomplishing this goal is through the integration of in-app ratios and comparable analyses on our platform.
The platform extends detailed analyses of four key financial metrics to provide users with a detailed understanding of where their target deals fit in the broader SMB landscape. These include medians for:
- Cash Flow: Measures the company’s ability to generate cash, highlighting liquidity and operational efficiency.
- EBITDA (Earnings Before Interest, Taxes, Depreciation, and Amortization): Provides insights into a business’s operational profitability, excluding the effects of financing and accounting decisions.
- SDE (Seller’s Discretionary Earnings): Represents the earnings before any owner-specific expenses are deducted, offering a clear picture of the potential income an owner can expect from the business.
- Gross Revenue: Represents the total sales income before deducting expenses, offering a perspective on the business’s market scale.
Understanding Price to Financial Metric Ratios
Price to financial metric ratios, or P/[Metric] ratios, are key indicators in business valuation, demonstrating how a given deal fits relative to other deals in the same industry. The introduction of median price to financial metric ratios on our platform offers users a benchmark for efficient comparison of business prices in relation to their financial performance. By providing these metrics across industries, the platform facilitates a nuanced understanding of valuation norms and trends across different sectors, aiding users in identifying both typical and exceptional investment opportunities.
Our analysis reveals notable variations in median price ratios across the top industries within the SMB sector:
Industry – Median Price / Cash Flow
1. Manufacturing – 3.42x
2. Education & Childcare – 3.13x
3. Healthcare – 3.02x
4. Construction – 3x
5. Automotive – 2.99x
6. Cleaning Services – 2.97x
7. Retail – 2.68x
8. Food & Groceries – 2.52x
9. Restaurant – 2.43x
10. Beauty and Hair Salon – 2.07x
Setting Buyer Expectations: Real-World Examples from Different Industries
Here are several examples from our platform, offering a blueprint of how a potential buyer could quickly interpret financial details. A thorough examination of ratios enables buyers to calibrate their expectations and investment strategies more effectively. Remember, however, that it is essential for potential buyers to analyze these ratios in the context of each industry’s norms and the specific dynamics of each business.
Example 1: Manufacturing
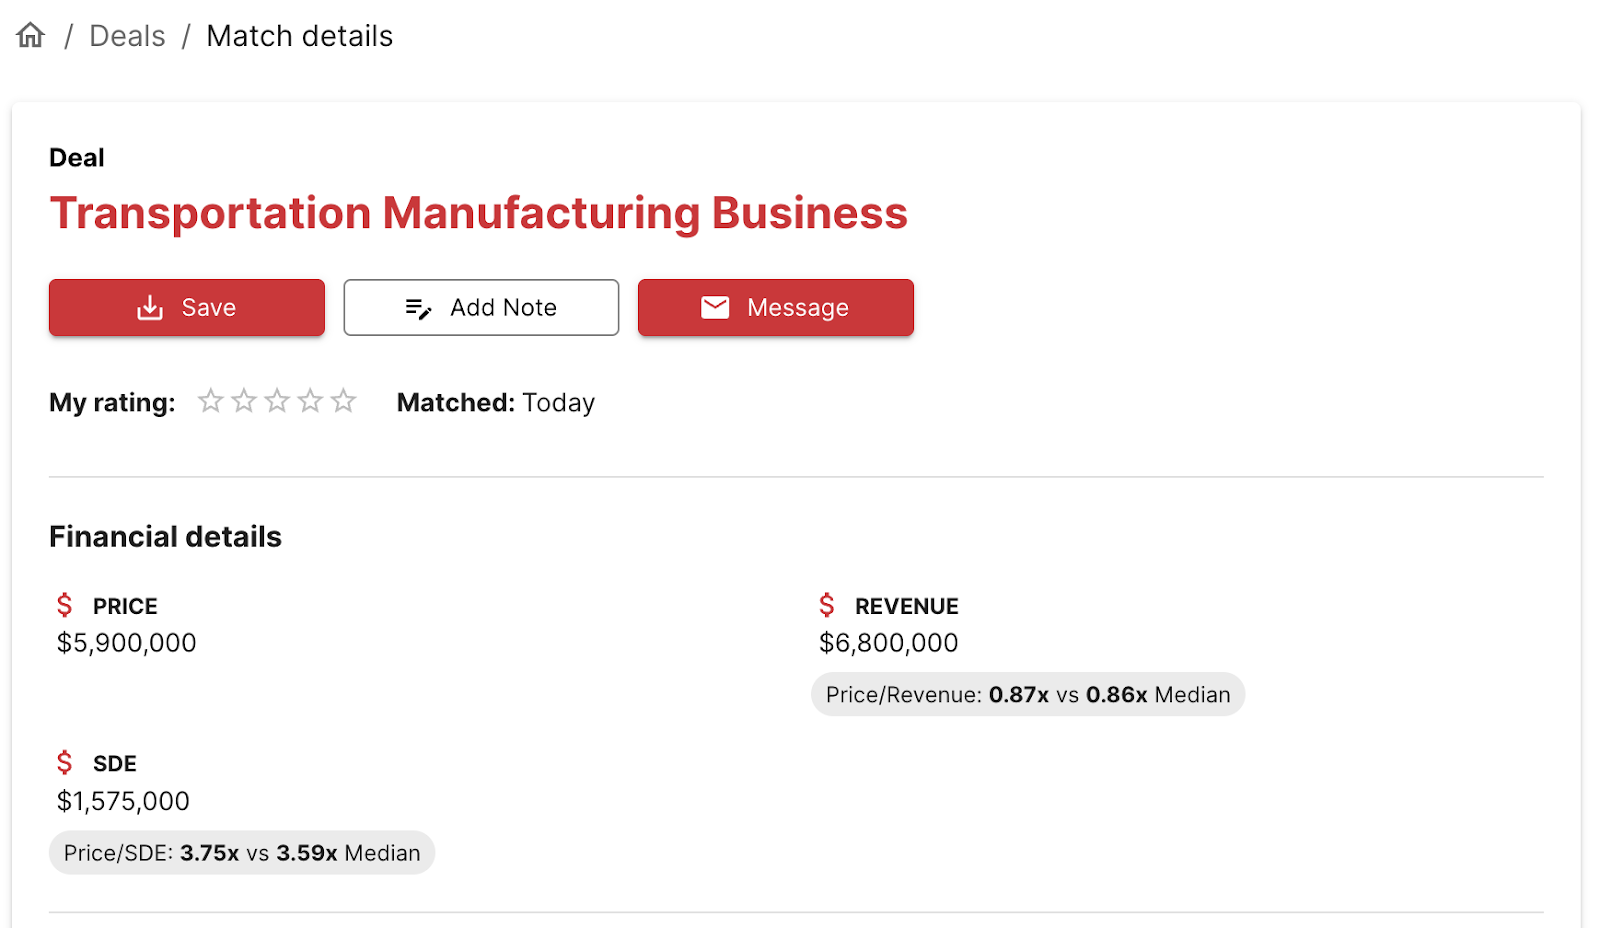
Transportation Manufacturing Business
Price: $5,900,000
Revenue: $6,800,000
SDE (Seller’s Discretionary Earnings): $1,575,000
Price to SDE Ratio
Reported Ratio: 3.75x
Industry Median: 3.59x
Price to Revenue Ratio
Reported Ratio: 0.87x
Industry Median: 0.86x
The business’s Price to SDE and Price to Revenue ratios are almost largely par with the median for the manufacturing industry, indicating a fair market valuation relative to its total sales.
Preliminary Conclusion: The valuation is consistent with industry norms regarding revenue but shows a modest premium when considering discretionary earnings. Interested buyers should focus on understanding the reasons behind this valuation to determine if the investment aligns with their financial goals.
Example 2: Education & Childcare
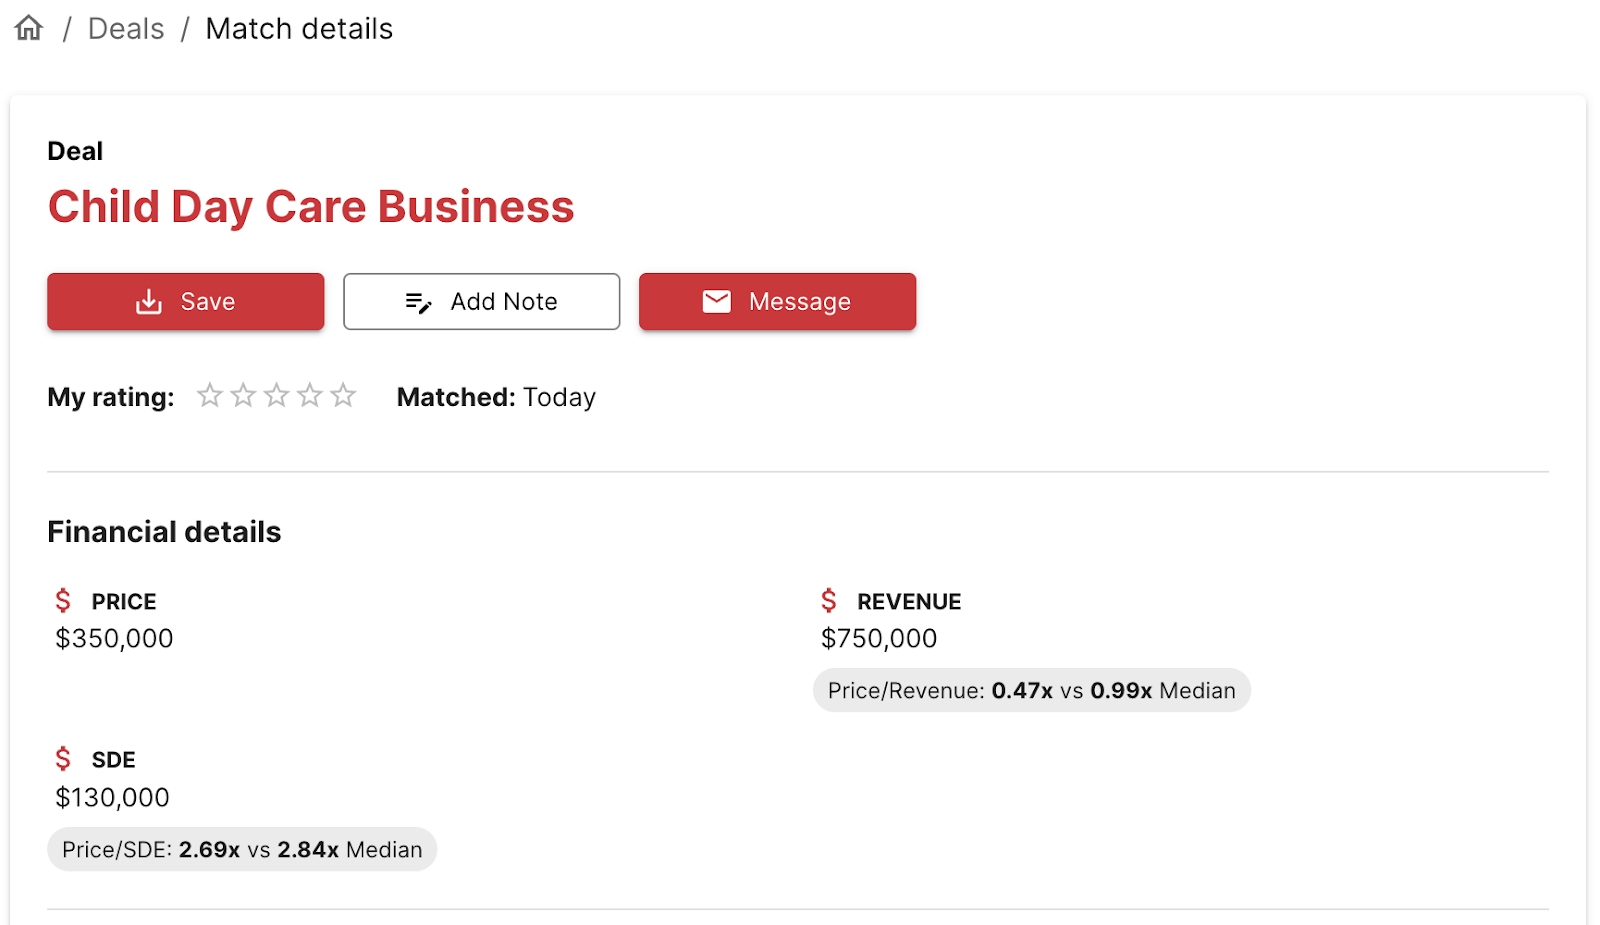
Child Day Care Business
Price: $350,000
Revenue: $750,000
SDE (Seller’s Discretionary Earnings): $130,000
Price to SDE Ratio
Reported Ratio: 2.69x
Industry Median: 2.84x
Price to Revenue Ratio
Reported Ratio: 0.47x
Industry Median: 0.99x
While Price to SDE is modestly below the median, the Price to Revenue ratio is significantly below the industry median, suggesting that the business is priced competitively in terms of its total sales. This lower ratio could appeal to buyers who are seeking a business with solid revenue at a more affordable entry point.
Preliminary Conclusion: Valuation appears to offer an opportunity in terms of both revenue and discretionary earnings. This could be particularly attractive to buyers who value the financial performance of a business and are looking for a cost-effective investment in the education and childcare industry. Further due diligence can help potential buyers understand the specific circumstances that may have led to this favorable pricing.
Example 3: Healthcare
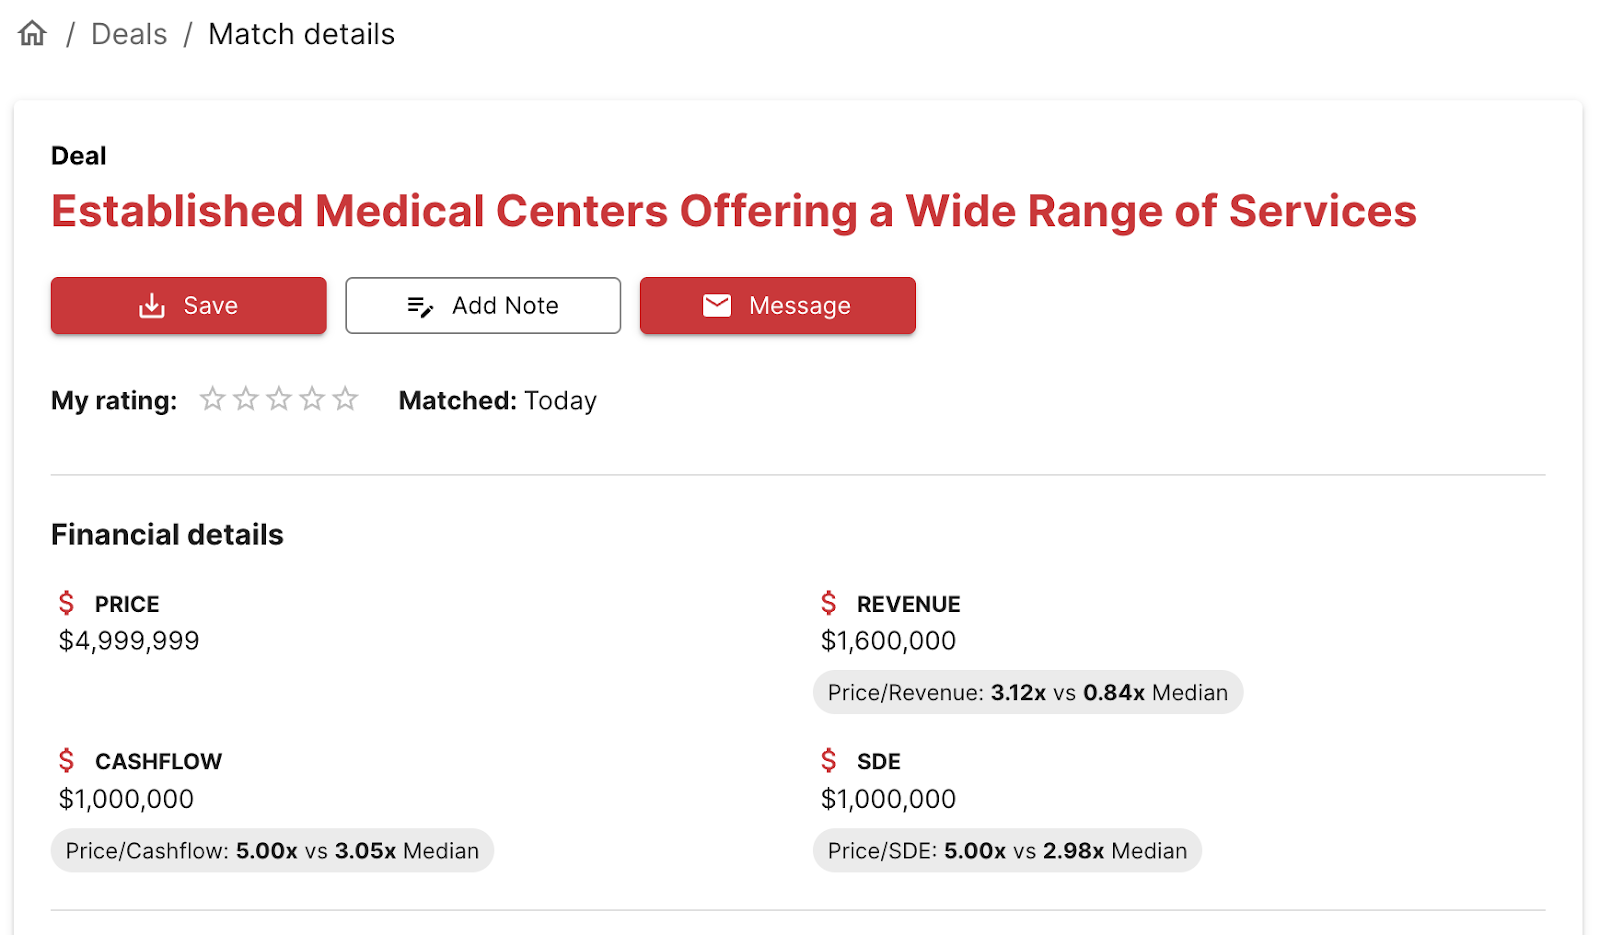
Established Medical Centers Offering a Wide Range of Services
Price: $4,999,999
Revenue: $1,600,000
SDE (Seller’s Discretionary Earnings): $1,000,000
Price to SDE Ratio
Reported Ratio: 5.00x
Industry Median: 2.98x
The Price to SDE ratio for this medical center is substantially higher than the industry median. This significant difference suggests that the center may possess strong underlying value drivers, such as a robust patient base, specialized services, or a prominent location, which could warrant a higher valuation. Alternatively, the higher price might indicate unreasonable expectations on the part of the seller or broker.
Price to Revenue Ratio
Reported Ratio: 3.12x
Industry Median: 0.84x
Similarly, the Price to Revenue ratio is notably above the median for the healthcare industry. This indicates that the medical center’s market price is quite high compared to its current revenue.
Preliminary Conclusion: Valuation markedly exceeds the median for both revenue and discretionary earnings. Such a premium may or may not be justified by unique competitive advantages, a strong reputation, or other non-financial benefits. Buyers should conduct an in-depth analysis to assess whether the higher price aligns with the long-term strategic value and opportunities the center presents.
Using Metrics for Getting Insights on Great Deals
It is worth highlighting the importance of looking at multiple financial metrics in order to gain a comprehensive understanding of a business’s worth. Below is a scenario where the perceived business value could be recognized in its SDE.
Our Commitment to Data-Driven Insights
Our dedication to providing high-quality data insights is at the forefront of this initiative. The release of in-app ratios and comps enhances the standards of data quality in the SMB M&A ecosystem, contributing to a more transparent market environment.
By offering a comprehensive data framework, we aim to support our users in making well-informed decisions, reinforcing our position as a dynamic and invaluable resource in the SMB M&A industry.